Helping HRs and Department Heads
run Calibration smoothly on Peoplebox

Fig 01- Representative image for Calibration
My Role
UX Lead - User Flows, Product Design, Rapid Prototyping
Team
Nikhil Manhas (PM)
Harsh Choudhary (UX)
Nilesh Pandit (SWE)
Tanmay Verma (SWE)
Nithya (Test)
Timeline
Version Releases V1-2 (Nov 2022 & July-Sept 2023) ), V3 (Feb 2024- Present)
Overview
Companies were performing reviews on Peoplebox, but the calibration exercise was performed outside on Excel and Sheets. This resulted in a lot of back-and-forth between the HRBPs and the Customer Success team to change the scores.
The final calibrated scores were then added to the PDF that was shared with the reviewees.
I played a pivotal role in designing the first version and then the subsequent versions of Calibration on Peoplebox.
The feature was very well received by the customers and was used by 29 distinct customers within the first version of its release.
Vid 01- Current version of calibration on the product
CONTEXT
What is Calibration?
When a manager enters the final score or scores for an employee during a performance review, HRs and company heads come together to readjust these scores. This adjustment is made for various reasons, ranging from reducing manager scoring bias to HR practices (such as aligning ratings to a bell curve), and business reasons like limiting the number of high ratings since they are linked to bonuses, promotions, and salary increments. This process is known as calibration.
While admins could collect the scores and feedback provided by managers through Peoplebox, they were unable to compare and visualize the data independently. The HR teams would then coordinate with the customer success team to prepare lengthy Google Sheets, and every time the scores were changed, our team would have to manually update them in the backend so that they would be accurately reflected in the final Review Summary (PDFs) released to the employees.


Fig 02- Calibration run on Excel
PROBLEM
The process of calibration is very long and it requires a lot of back and forth with the HRs, Managers and Company Heads. The flow chart below shows a typical calibration process-

Fig 03- Typical flow of Clalibration in companies

What Happens?
Managers must prepare in advance to justify their ratings.
The calibration process is collaborative involving managers, skip-level managers, HRs, and executives.
Scoring is typically based on the philosophy that employee performance should align with a bell curve.
What are the problems?
Keeping a record of scores entered by each manager on multiple excel sheets.
Contacting customer support for manual score adjustments to ensure accuracy in the PDF.
Facing challenges in collaborating with stakeholders and visualising employees' score distribution.
“I personally would want one tool for everything. I don’t want to use 10 tools.“ -User
GETTING TO SOLUTIONING

Fig 04- Timeline of my process
Competitive Research
I started with looking at our primary competitors (Lattice & Leapsome) and how do they solve this problem. Both of the platforms have
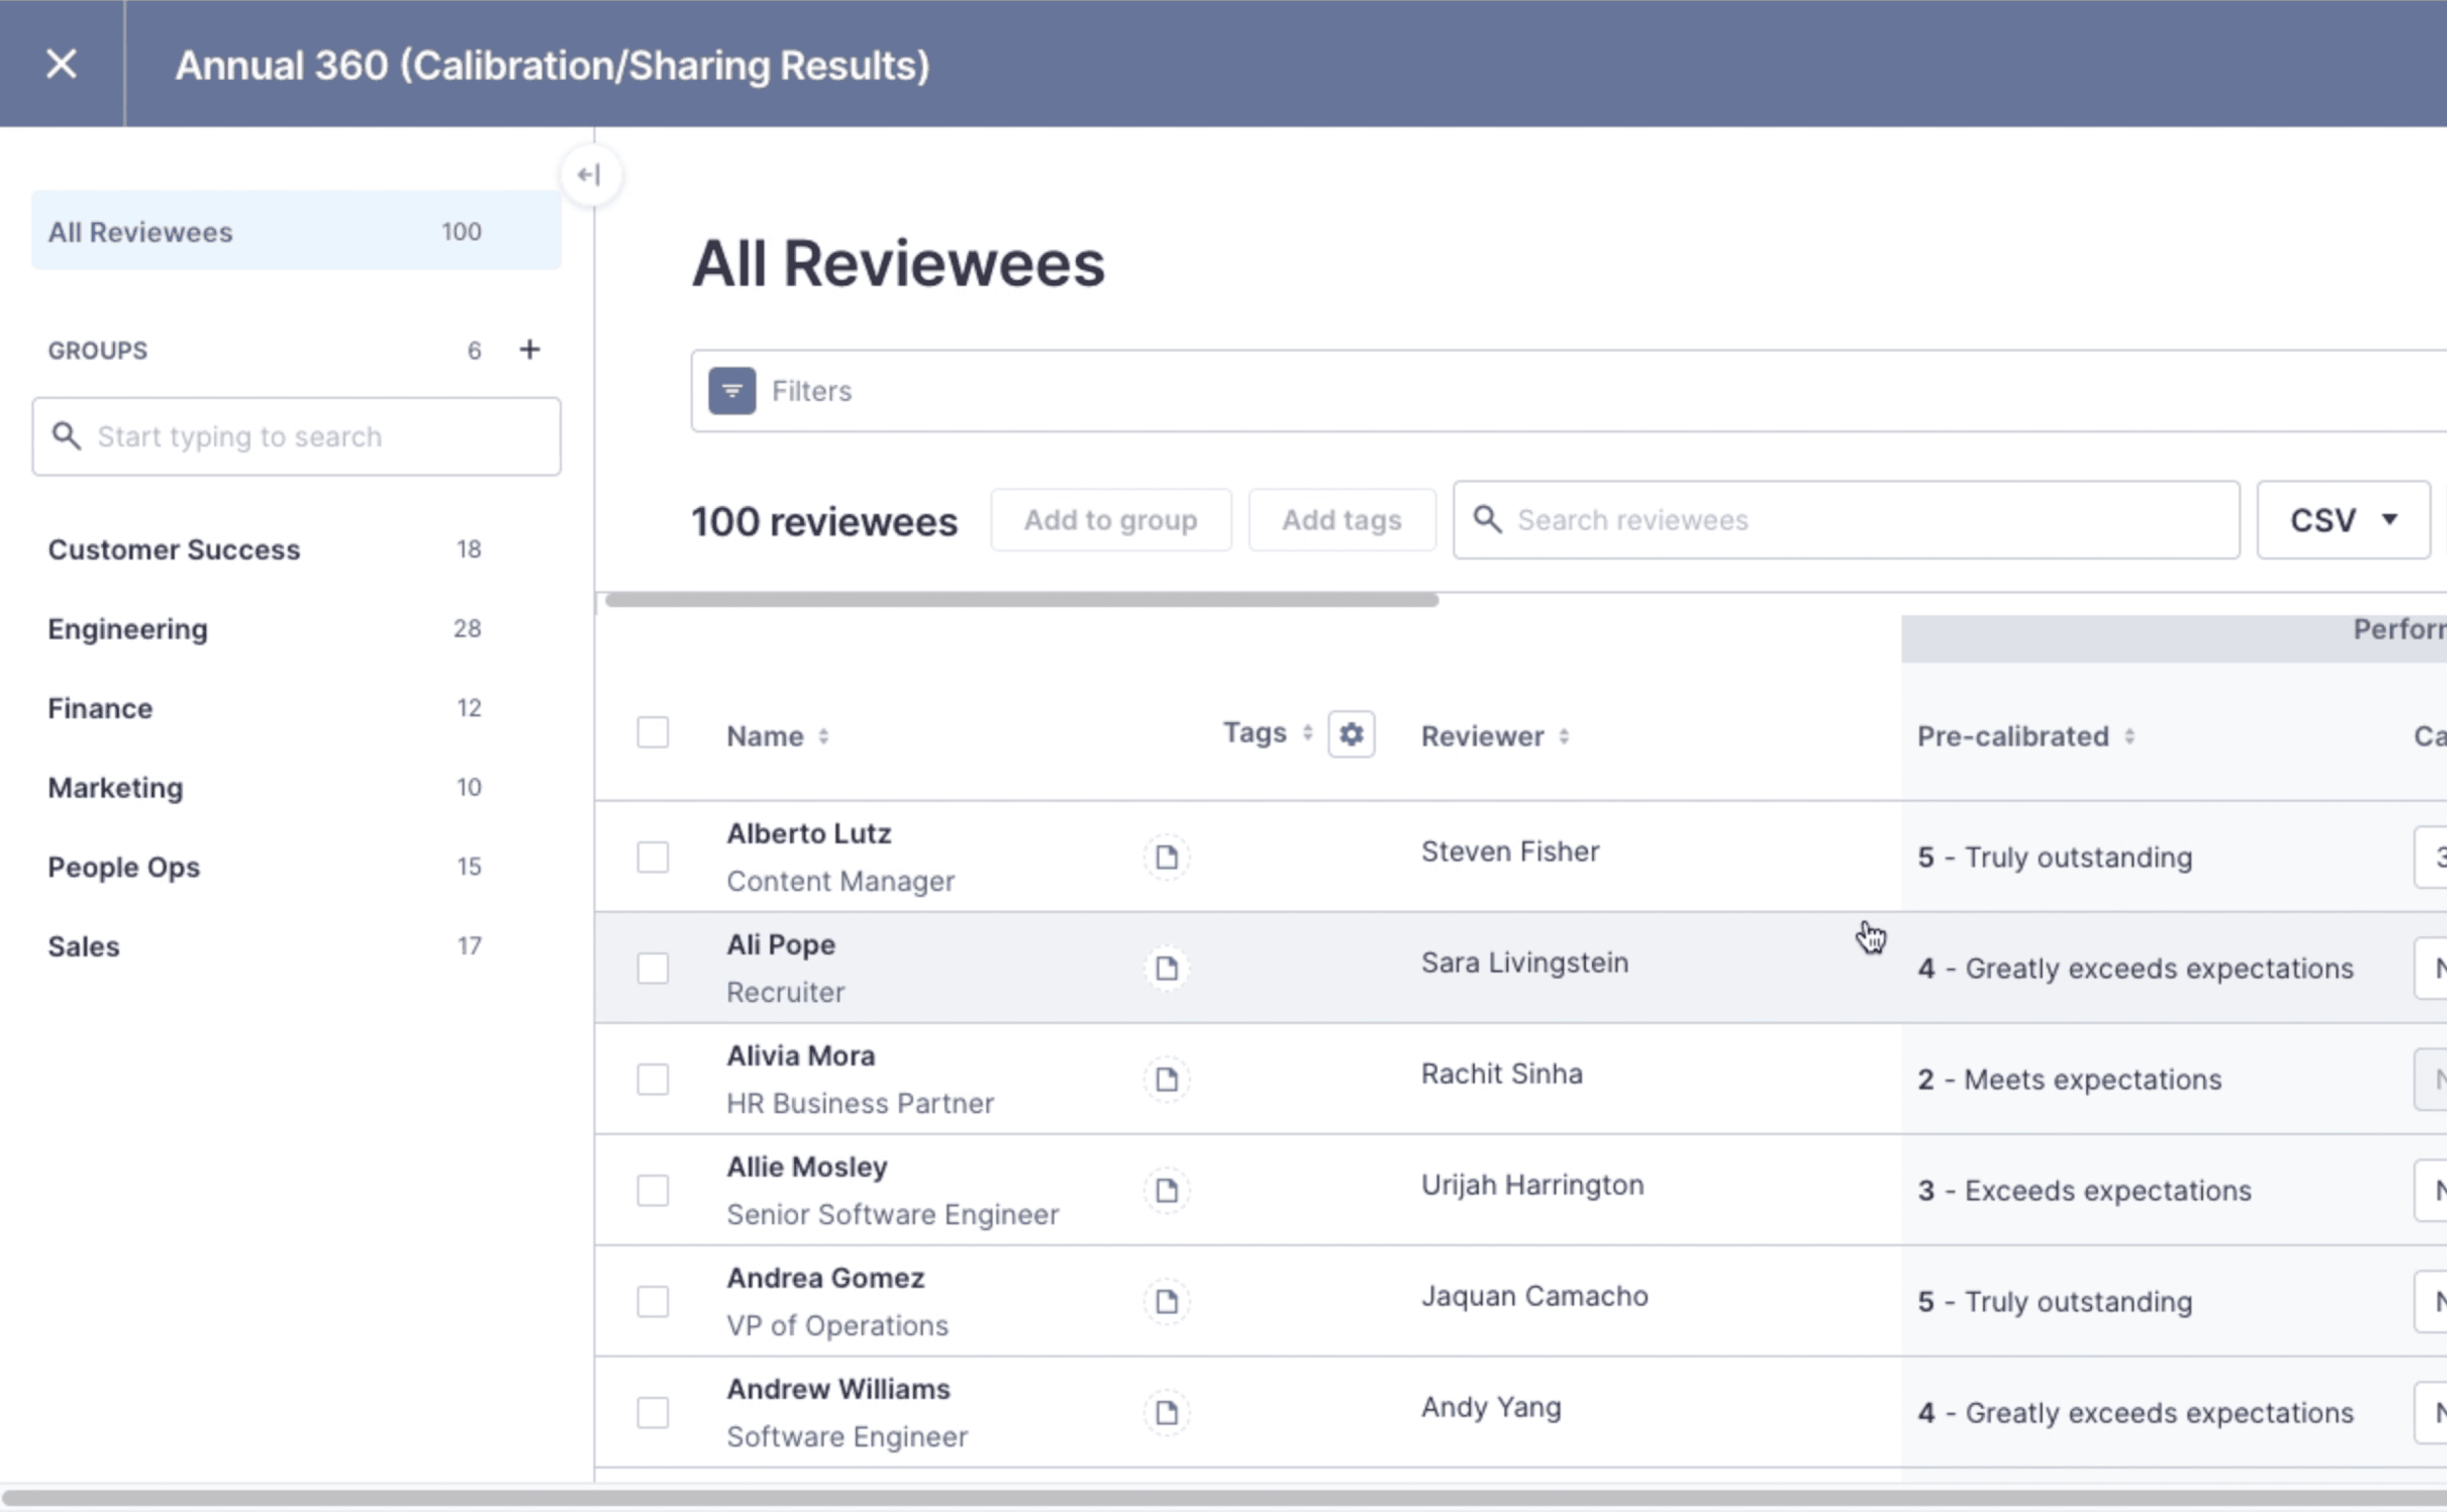
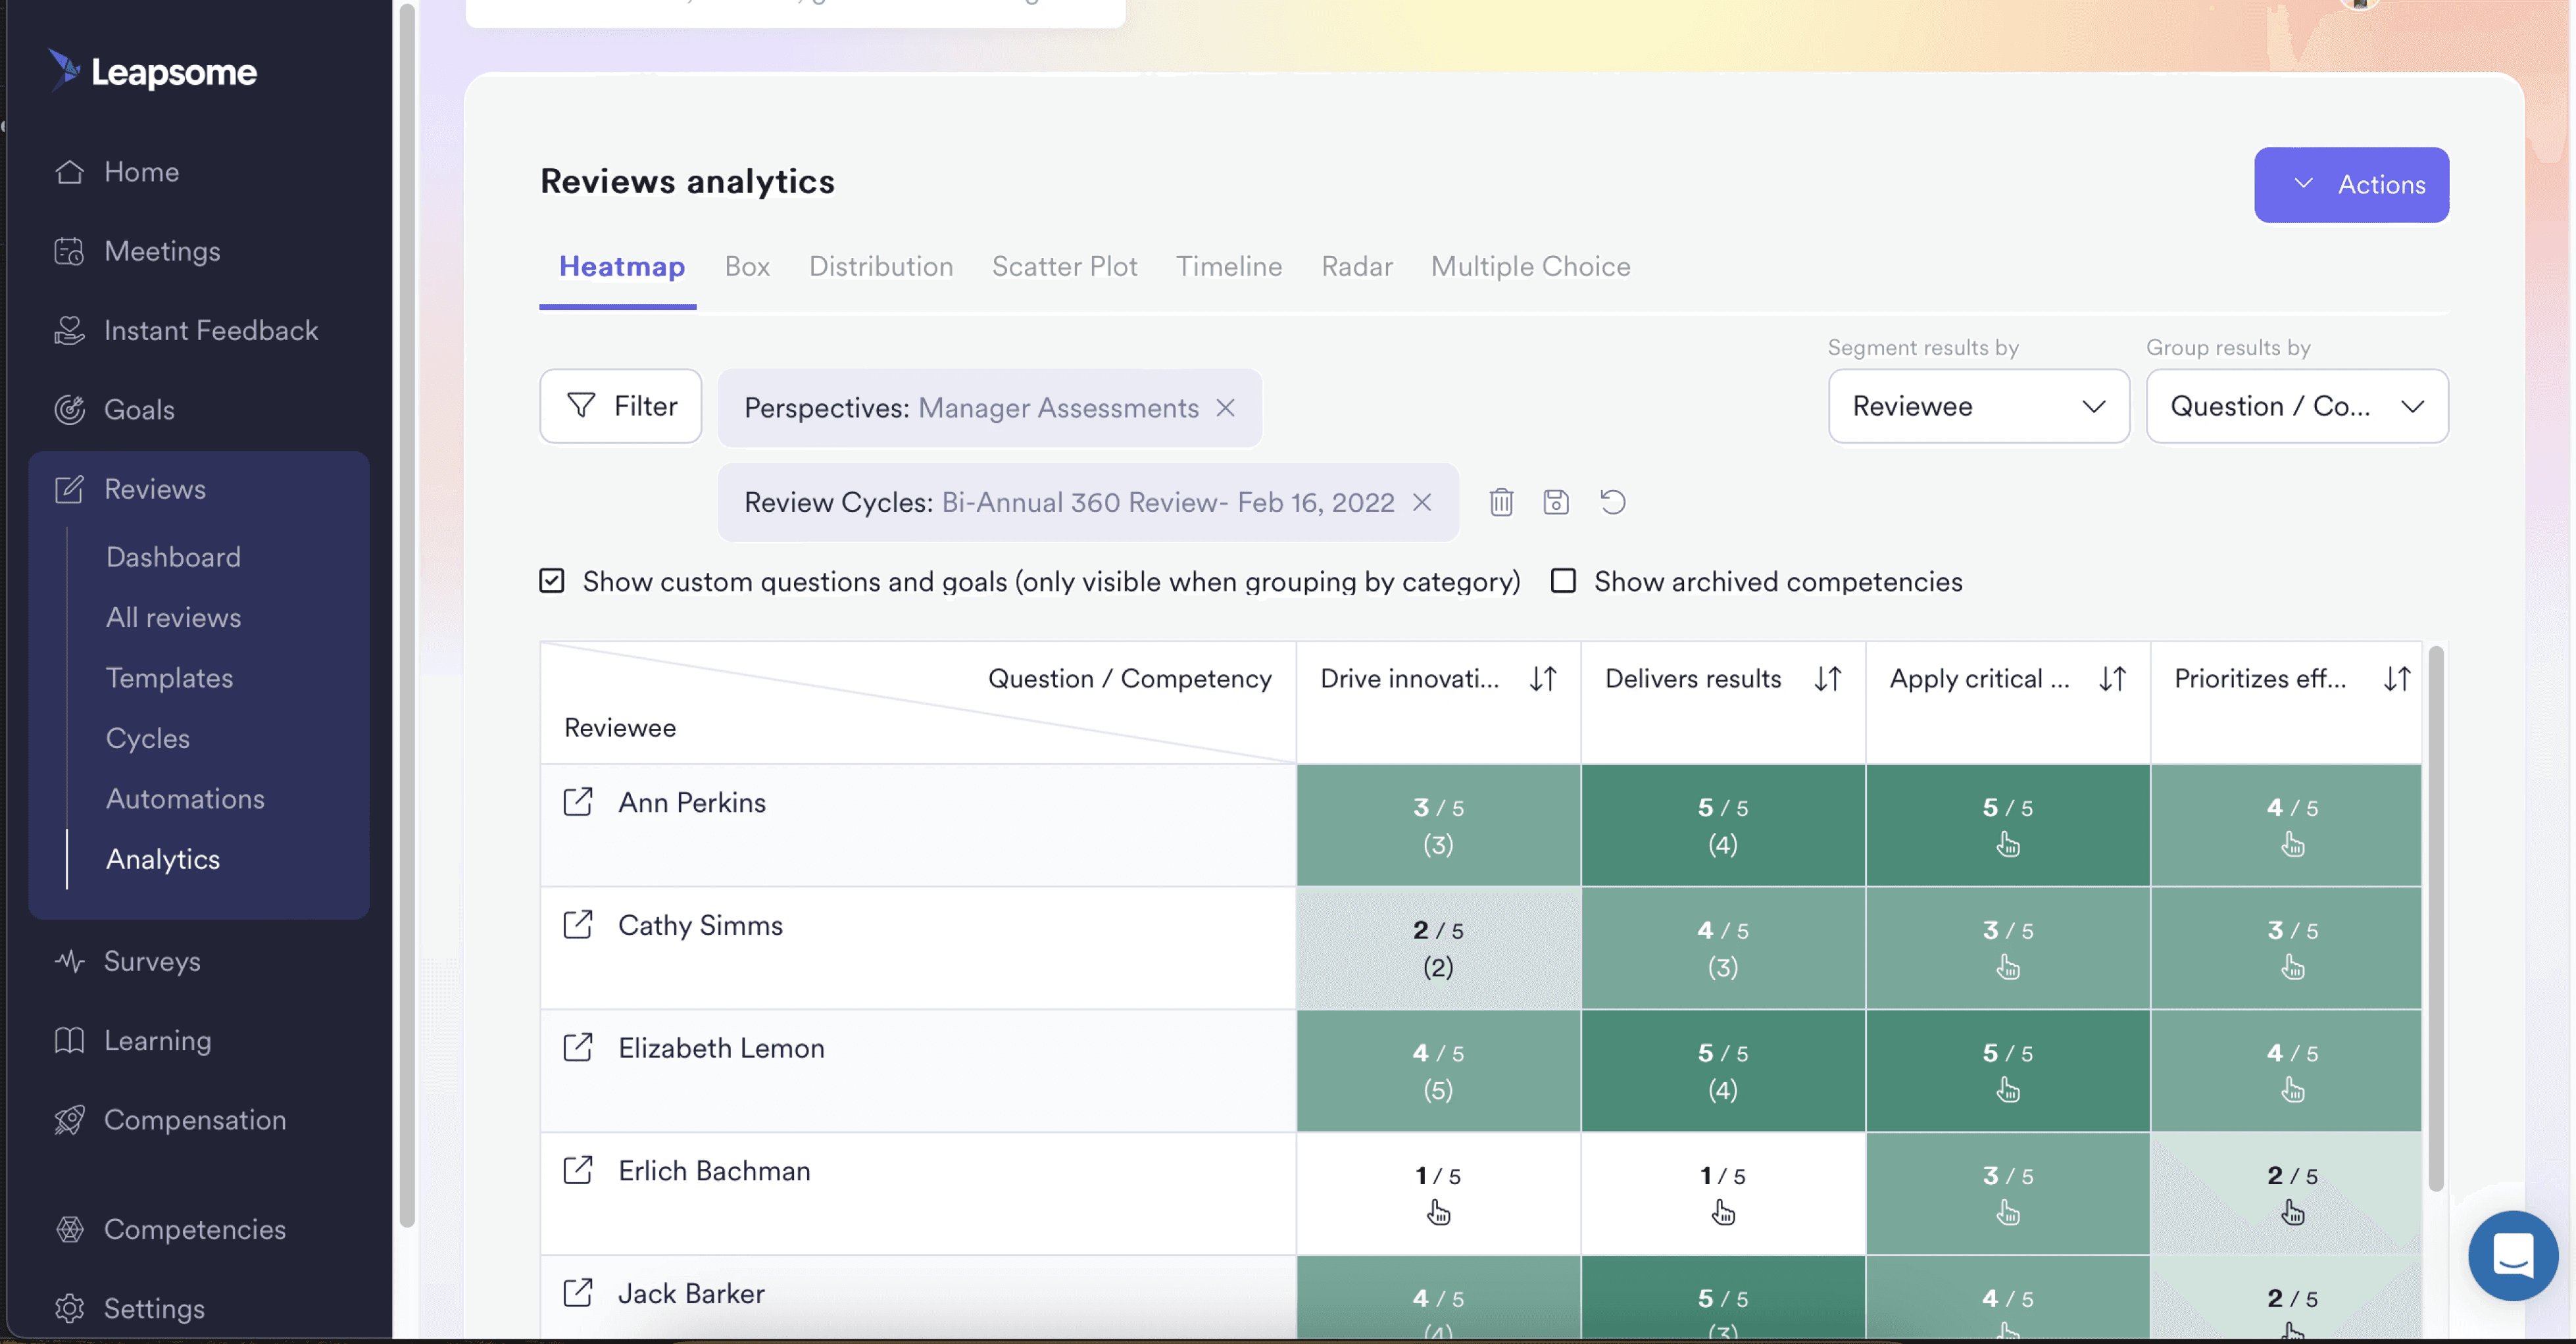
Fig 05- Lattice & Leapsome Calibration Modules
Lattice- I found out that Lattice has a very restrictive way of adding scores. You cannot add scores in decimals. You can only add whole numbers as scores which was not suited for our use-case. Check it here
Leapsome- Leapsome’s experience of a pop-up opening up everytime a user wanted to add a calibrated score was a bit disorienting. Also, you could not visualise the score delta on leapsome. Check it here
For our usecase, following was needed to be kept in mind-
Users wanted to see the entire question.
They wanted the ability to add or remove additional columns while performing calibration.
They wanted to be able to add decimal scores and not just whole numbers for the reviewees.
Version (0)-

Version 1 (released in Nov 2022)-

Version 3 (released in Sept 2023)-

This version also included ability to perform following actions-
Ability to visualise the tabular data on bar and line charts.


Fig 06- Bar & Line Chart to visualize the Bell Curve distribution
Ability to visualise employees in a 9 box.

Fig 07- 9 box Visualisation
9-box visuakisation helps to bucket employees in 9-boxes based on 2 parameters, Usually these parameters are Performance and Potential. In our usecase, users have the ability to compare any two distinct questions.
Ability to Manage Columns and add additional columns.

Fig 08- "Manage Columns" Experience
IMPACT
After its launch, the Calibration module was used by 31 distinct customers over 175 unique performance reviews. A total of 2000 unique calibration questions were created in the past 12 months.
CHALLENGES
With the launch of the Calibration module we noticed some obvious UX issues that were faced by the customers. These were-
Column width was still a challenge for adding responses.
There were only 2-3 rows appearing on a smaller screens.
The “Show Analytics” feature was not discoverable easily. Even when a user toggled it on, they were unable to
recognize that they have to add relevant questions to see the distribution.
The text column editing experience was very disruptive. Every time a user needed to read or edit a response, they
would be forced to open the side drawer.
Additional features like renaming, resizing columns were also missing that were present in the sheets experience.
Introducing Calibration V3

Removed the white colour in the header. The idea was to reduce the variance created by too many shifts in background colours. I also added a simpler back button that is a part of the button component in our new design system.
Brought the graphs as buttons upfront instead of being hidden behind a switch, to improve the discoverability.
Added a way to enter “Full Screen Mode” so that HRs and managers can focus exclusively on the calibration exercise while running a meeting.
The question can now be replaced with an alias. This reduces the width and increases the number of columns.
In addition to the Admins performing calibration, we are going to provide a similar experience to managers to add their final scores which (called soft score by some companies) on which calibration is performed.
Check the prototype here to see all the ineractions that I have worked on. Prototype